Image Details
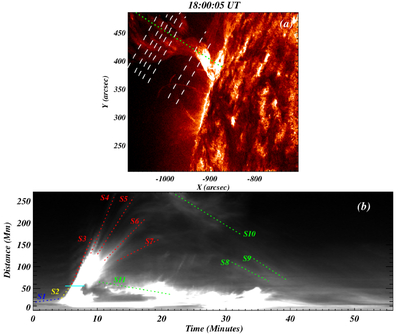
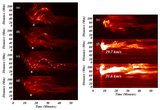
Caption: Figure 6.
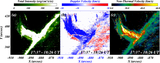
The top panel shows the intensity image of the maximum phase of the blowout jet taken at 18.04 UT in the AIA 304 Å filter. One slit along the jet (vertical green dotted line) and seven slits (horizontal white-dashed slits) are used to produce TD diagrams. The TD diagram corresponding to the slit along the jet (i.e., green dotted line) is displayed in the bottom panel. Various paths have been drawn on the TD image to estimate the speeds of various features, namely, the slow rise in the prominence (blue path S1), the rapid rise phase of the prominence (yellow path S2), upflow speeds of different plasma threads (red paths S3-S7), and downflow speeds of different plasma threads (green paths S8–S11).
Other Images in This Article
Show More
Copyright and Terms & Conditions
© 2026. The Author(s). Published by the American Astronomical Society.