Image Details
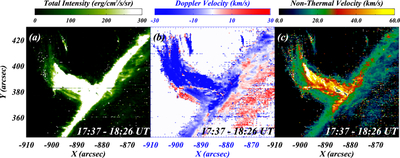
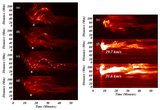
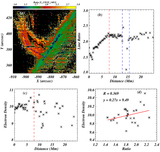
Caption: Figure 9.
Panels (a)–(c) show the spectral intensity, Doppler velocity, and nonthermal velocity maps of the observed region, respectively. These maps are obtained by fitting a Gaussian function to the Si IV profiles for each pixel of the observed region.
Other Images in This Article
Show More
Copyright and Terms & Conditions
© 2026. The Author(s). Published by the American Astronomical Society.
Copyright ©
2026 Astronomy Image Explorer. All Rights Reserved.