Image Details
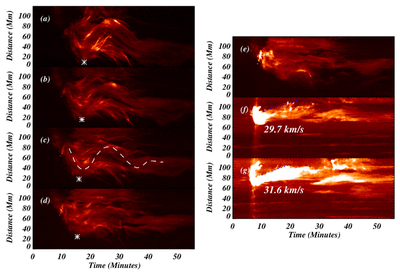
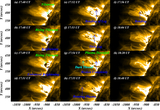
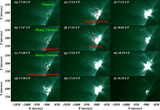
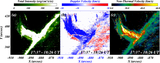
Caption: Figure 7.
The figure shows various TD images corresponding to the slits across the jet (see the white-dashed lines in Figure 6(a). The TD image in panel (a) corresponds to the top white slit in Figure 6(a). While the TD image in panel (g) corresponds to the bottom-most white slit in Figure 6(a). The TD image from the last two slits (i.e., white slits below the bended location) shows that the spire of the blowout jet expands at a speed of around 30 km s−1. The TD image from the top five slits (i.e., above the bended spire) shows transverse oscillations, and the main oscillation is manually shown by the white-dashed path in panel (c). The trough position (indicated by the white asterisk in panels (a)–(d)) is used to estimate the phase speed.
Other Images in This Article
Show More
Copyright and Terms & Conditions
© 2026. The Author(s). Published by the American Astronomical Society.