Image Details
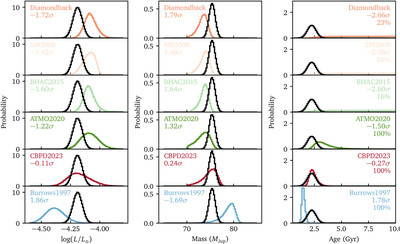
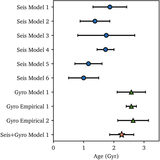
Caption: Figure 13.
Comparisons between the observed and model-predicted properties of HR 7672B, where the predicted value of each property is calculated based on the other two. The black lines represent the observed distributions, and the colored lines show the model predictions. The numbers in each panel indicate the significance level of the discrepancy between the two distributions. In the rightmost column (age), the model-coverage fraction (the proportion of sampled points that lie within the bounds of physical models at 10 Gyr) is also shown.
Other Images in This Article
Show More
Copyright and Terms & Conditions
© 2026. The Author(s). Published by the American Astronomical Society.
Copyright ©
2026 Astronomy Image Explorer. All Rights Reserved.