Image Details
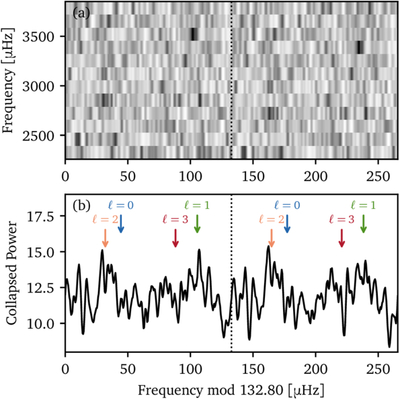
Caption: Figure 4.
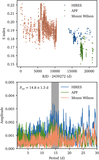
(a) Replicated echelle diagram of the TESS power spectrum. (b) Collapsed echelle diagram by summing the power along the y-axis of panel (a). The expected mode positions, informed by the KPF data, are indicated by arrows.
Other Images in This Article
Show More
Copyright and Terms & Conditions
© 2026. The Author(s). Published by the American Astronomical Society.
Copyright ©
2026 Astronomy Image Explorer. All Rights Reserved.