Image Details
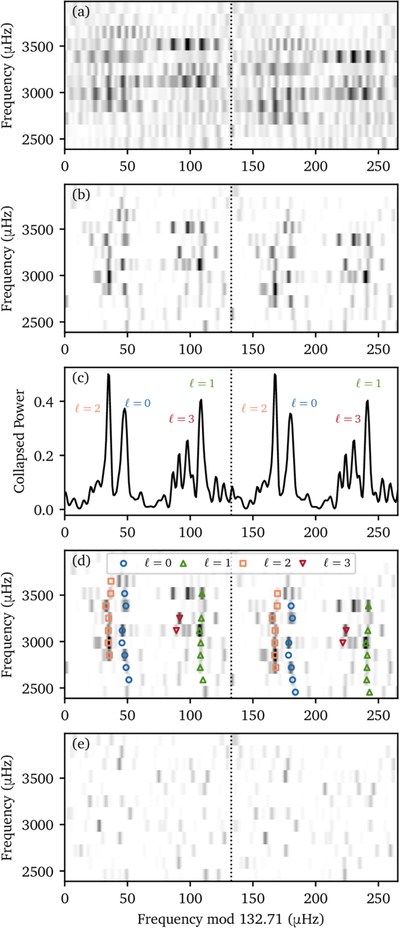
Caption: Figure 2.
Replicated echelle diagrams showing structures of regular frequency spacings from KPF data. (a) Echelle diagrams of the original power spectrum. (b) Echelle diagram after deconvolving with the spectral window and then smoothing with a 1 μHz width Gaussian filter. (c) Collapsed echelle diagram by summing the power along the y-axis of panel (b). (d) Same as panel (b) but highlighting the oscillation modes. (e) Deconvolved power spectrum of the residual time series after subtracting oscillation modes.
Other Images in This Article
Show More
Copyright and Terms & Conditions
© 2026. The Author(s). Published by the American Astronomical Society.
Copyright ©
2026 Astronomy Image Explorer. All Rights Reserved.