Image Details
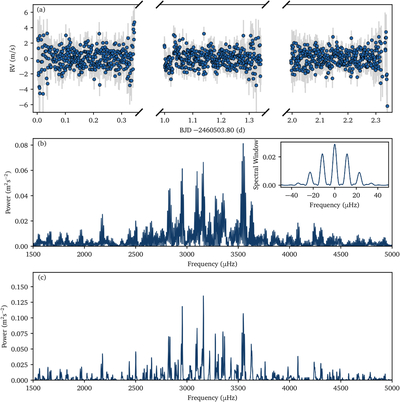
Caption: Figure 1.
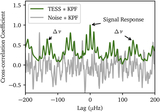
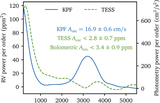
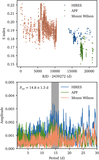
RV observations of HR 7672A over 3 consecutive nights using the KPF. (a) RV time series after filtering out signals with periods longer than 1.2 hr. (b) Power spectrum of the RV time series, weighted by the reported RV uncertainties, displaying a clear power excess around 3000 μHz. The inset shows the spectral window. (c) Power spectrum after deconvolution against the spectral window, followed by reconvolution with a Gaussian filter of width 1/Tobs for clarity.
Other Images in This Article
Show More
Copyright and Terms & Conditions
© 2026. The Author(s). Published by the American Astronomical Society.
Copyright ©
2026 Astronomy Image Explorer. All Rights Reserved.