Image Details
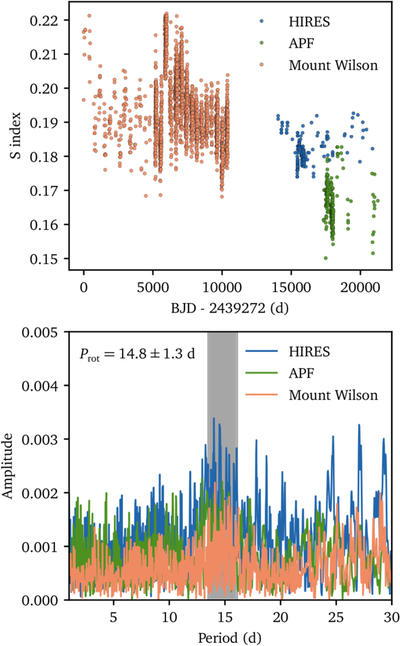
Caption: Figure 7.
Top: time series of the S index measured from Ca H and K emissions. Bottom: amplitude spectra of S-index measurements from various sites, showing clear signals around 14.8 days corresponding to rotation.
Other Images in This Article
Show More
Copyright and Terms & Conditions
© 2026. The Author(s). Published by the American Astronomical Society.
Copyright ©
2026 Astronomy Image Explorer. All Rights Reserved.