Image Details
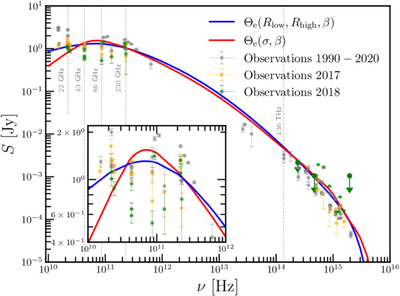
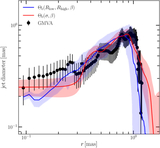
Caption: Figure 5.
Broadband spectrum of the flux-density of M87*. Solid lines show the average spectra from simulations with different spins and numerical parameters, as computed over the time window between 13,000 M and 15,000 M for both nonthermal models and for an inclination i = 160∘. Note that the gray vertical lines refer to the most representative frequencies. For each observational data, the uncertainties indicate the variability during the observations. The inset shows a magnification of the low-frequency region.
Other Images in This Article
Copyright and Terms & Conditions
© 2026. The Author(s). Published by the American Astronomical Society.
Copyright ©
2026 Astronomy Image Explorer. All Rights Reserved.