Image Details
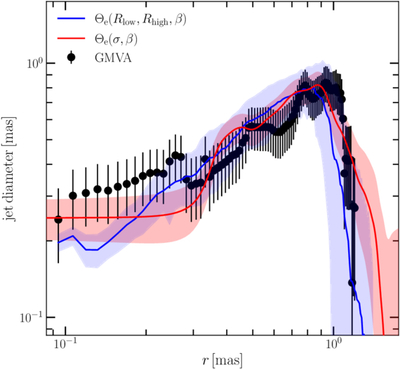
Caption: Figure 4.
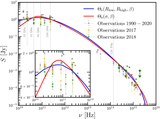
Jet-diameter comparison between observations and theoretical models. We report with solid lines the jet width measurements from the convolved GRRT images covering a period of 2000 M, red line for the self-consistent Θe = Θe(σ, β), and blue line for the phenomenological Θe = Θe(Rlow, Rhigh, β). We also show as shaded regions the variations within the standard deviation and with black circles the jet width as computed from the GMVA observation and the corresponding uncertainties. The uncertainties are obtained by assuming an uncertainty of 1/4 of the beam size at the r = 0 and a linear increase until 1/2 of the beam size is reached at r = 2 mas.
Other Images in This Article
Copyright and Terms & Conditions
© 2026. The Author(s). Published by the American Astronomical Society.