Image Details
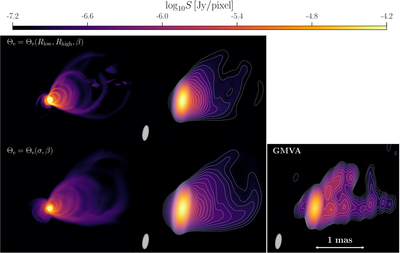
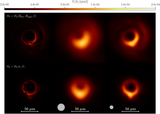
Caption: Figure 3.
Best-fit models for the jet morphology of M87* as obtained from the most recent GMVA observations at 86 GHz (J. Y. Kim et al. 2018) (bottom-right panel). The left and middle columns refer to data that is azimuthally and time averaged over the interval 13,000–15,000, M, for a BH with dimensionless spin a⋆ = 0.9375. The top-left panel refers to the best-fit phenomenological model for the electron temperature, Θe = Θe(Rlow, Rhigh, β), corresponding to Rlow = 1 and Rhigh = 160, and a κ-distribution from a current sheet with parameters ϵ = 0.5, σcut = 3.0, rinj = 10 M. The bottom-left panel shows instead the best-fit model using the self-consistent electron temperature, Θe = Θe(σ, β), and a κ-distribution derived from a turbulent scenario. In this case, with ϵ = 1.0, σcut = 3, rinj = 10 M. The middle column displays the GRRT synthetic image convolved with a GMVA-like beam of 116 μas × 307 μas, to mimic the observational resolution.
Other Images in This Article
Copyright and Terms & Conditions
© 2026. The Author(s). Published by the American Astronomical Society.