Image Details
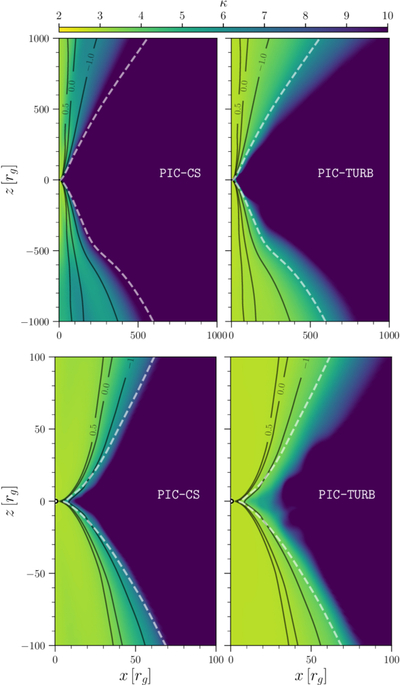
Caption: Figure 1.
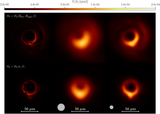
Top panels: Time and azimuthally averaged distributions of the power-law index κ for accretion simulations onto a rotating BH with dimensionless spin a⋆ = 0.9375. The left panel refers to the PIC-CS kappa model derived from Harris current sheets (Equation (11)), while the right panel exhibits the distribution for the PIC-TURB derived from decaying plasma turbulence (Equation (12)). Bottom panels: The same as on the top but shown on a smaller scale near the event horizon. Despite the similarity in the functional dependence, the two models for the power-law index κ can lead to differences, especially in the jet width (see also Figure 2). The black solid lines represent the separation between the jet spine and jet sheath and are defined by ﹩{\mathrm{log}}_{10}\sigma =\{-1,\,0,\,0.5\}﹩; the dashed white line refers instead to the Bernoulli parameter Be = 1.02 and separates the bound and unbound plasma, thus marking the external surface of the jet.
Other Images in This Article
Copyright and Terms & Conditions
© 2026. The Author(s). Published by the American Astronomical Society.