Image Details
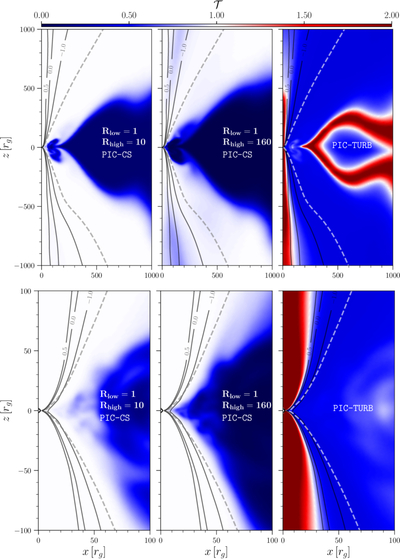
Caption: Figure 2.
Comparison of the distributions in the electron-temperature ratio, ﹩{ \mathcal T }:= {T}_{e}/{T}_{p}﹩, using either the R − β model with the PIC-CS model for the nonthermal component or the fully self-consistent prescription from turbulence simulations using the PIC-TURB model. More specifically, the left and middle columns report ﹩{ \mathcal T }﹩ with parameters Rlow = 1 and Rhigh = {10, 160}, while the right column refers to the self-consistent model. Note the considerable differences, especially in the core of the jet and near the torus surface. While the top row shows the large-scale distributions, the bottom row offers a magnification near the event horizon. Also in this case, the black solid lines mark the separation between the jet spine and jet sheath, while the white dashed lines mark the separation between bound and unbound plasma.
Other Images in This Article
Copyright and Terms & Conditions
© 2026. The Author(s). Published by the American Astronomical Society.