Image Details
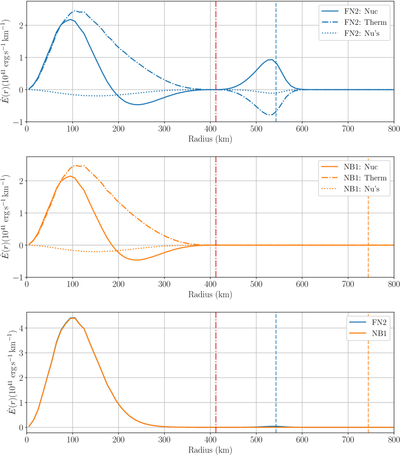
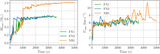
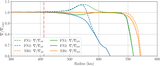
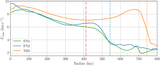
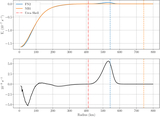
Caption: Figure 8.
Top plot: energy generation rate components per radial bin in the FN2 simulation. Middle plot: energy generation rate components per radial bin in the NB1 simulation. Bottom plot: Total energy generation rate per radial bin with all the contributions summed up. The blue lines represent the FN1 simulation, the orange lines the NB2, and the vertical lines indicate the convective boundaries.
Other Images in This Article
Show More
Copyright and Terms & Conditions
© 2026. The Author(s). Published by the American Astronomical Society.
Copyright ©
2026 Astronomy Image Explorer. All Rights Reserved.