Image Details
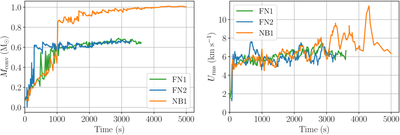
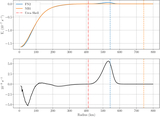
Caption: Figure 4.
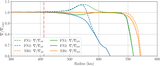
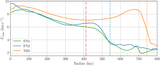
The left plot tracks the mass contained in the convection zone, Mconv, over simulation time. The right plot shows the Urms of the convection zone over time. We plot all three simulations with FN1 in green, FN2 in blue, and NB1 in orange.
Other Images in This Article
Show More
Copyright and Terms & Conditions
© 2026. The Author(s). Published by the American Astronomical Society.
Copyright ©
2026 Astronomy Image Explorer. All Rights Reserved.