Image Details
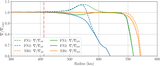
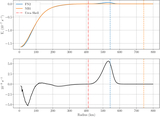
Caption: Figure 1.
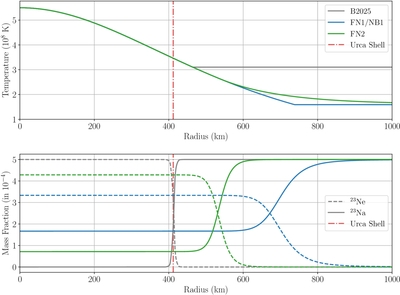
Top plot: star temperature vs. radius profiles. Bottom plot: mass fraction of the Urca species vs. radius. The gray curves represent the initial state of the simulations in B2025, the blue curves the initial state of the FN1 and NB1 simulations, and the green curves the initial state of the FN2 simulation. The dashed curves represent the 23Ne and the solid ones the 23Na. The vertical red line indicates the position of the Urca shell.
Other Images in This Article
Show More
Copyright and Terms & Conditions
© 2026. The Author(s). Published by the American Astronomical Society.
Copyright ©
2026 Astronomy Image Explorer. All Rights Reserved.