Image Details
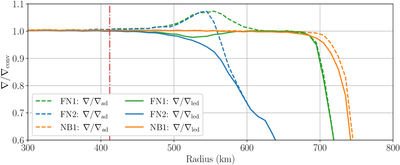
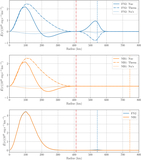
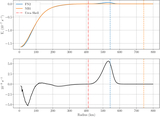
Caption: Figure 5.
Spherically averaged convective gradient profiles vs. radial bin for each simulation. The dashed curves represent the ratio of the real gradient to an adiabatic ( ∇ /∇ad. The solid curves represent the ratio of the real gradient to the Ledoux gradient ( ∇ /∇Led. The green curve is from the FN1 simulation. The blue curve from the FN2 simulation. And the orange curve from the NB1 simulation. The red vertical dashed–dotted line indicates the location of the Urca Shell.
Other Images in This Article
Show More
Copyright and Terms & Conditions
© 2026. The Author(s). Published by the American Astronomical Society.
Copyright ©
2026 Astronomy Image Explorer. All Rights Reserved.