Image Details
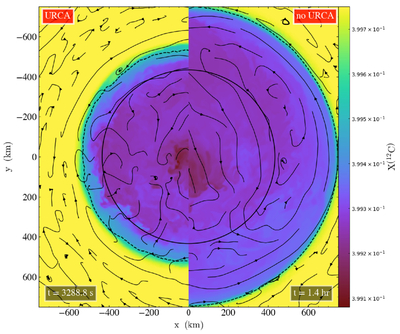
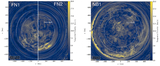
Caption: Figure 2.
2D slice through the center of the WD colored by the value of X(12C) at the end of the simulation. The solid and dashed black lines represent the Urca shell and the boundary where X(23Na) = X(23Ne), respectively. The black streamlines indicate the trajectories of the convective flows. The left slice represents the FN2 simulation, and the right one the NB1 simulation.
Other Images in This Article
Show More
Copyright and Terms & Conditions
© 2026. The Author(s). Published by the American Astronomical Society.
Copyright ©
2026 Astronomy Image Explorer. All Rights Reserved.