Image Details
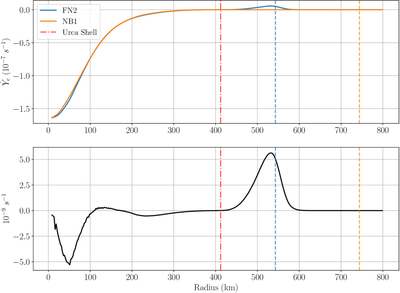
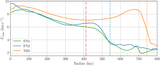
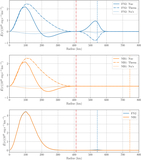
Caption: Figure 10.
Top plot: electron fraction rate. The blue curves represent the FN2 simulation that considers the Urca reactions, and the orange ones the NB1 simulation that excludes β-decays. Bottom plot: the difference between the electron fraction rate profiles plotted above. The vertical red line indicates the presence of the Urca shell, and other vertical dashed lines indicate the boundary of the convective region in each simulation.
Other Images in This Article
Show More
Copyright and Terms & Conditions
© 2026. The Author(s). Published by the American Astronomical Society.
Copyright ©
2026 Astronomy Image Explorer. All Rights Reserved.