Image Details
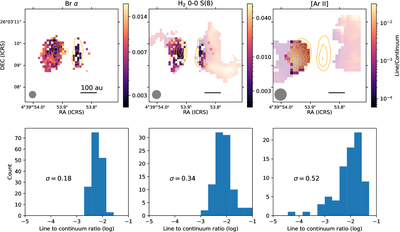
Caption: Figure 7.
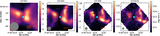
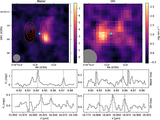
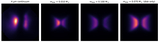
Top: line-to-continuum ratio maps for Brα, H2 0-0 S(8), and [Ar II]. We have masked out the regions where the line emission is below the 1σ threshold. Additionally, we emphasize the inner region of the map where the Brα emission is present by making regions outside of this fainter. The contours represent the local continuum. Bottom: histograms of the line-to-continuum ratio maps along with the standard deviation. These histograms are generated from only the compact emission, where Brα is present, to better compare the different species on the same spatial scales. These maps and histograms show that the line-to-continuum ratio is more constant for Brα compared to H2 and [Ar II], supporting the interpretation that the Brα is likely being observed in scattered light.
Other Images in This Article
Show More
Copyright and Terms & Conditions
© 2026. The Author(s). Published by the American Astronomical Society.