Image Details
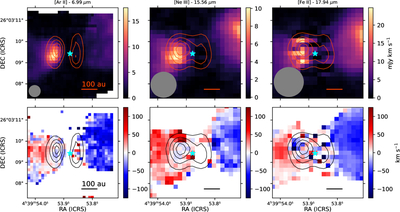
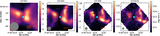
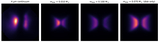
Caption: Figure 5.
Top row: continuum-subtracted moment 0 maps for [Ar II], [Ne III], and [Fe II]. Bottom row: continuum-subtracted moment 1 maps for the same species. Pixels below the 3σ level in the moment 0 maps have been masked out of the moment 1 maps. For both rows, the contours show the local continuum.
Other Images in This Article
Show More
Copyright and Terms & Conditions
© 2026. The Author(s). Published by the American Astronomical Society.
Copyright ©
2026 Astronomy Image Explorer. All Rights Reserved.