Image Details
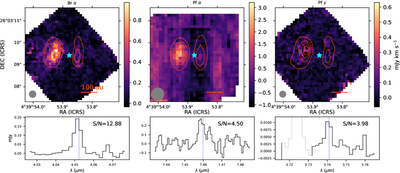
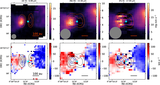
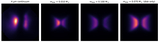
Caption: Figure 2.
Top row: continuum-subtracted moment 0 maps for the three detected atomic hydrogen lines. The contours correspond to the local continuum emission. Bottom row: the corresponding line profiles for the atomic hydrogen lines along with the S/N ratio of the line. The line profiles were extracted using the elliptical apertures shown in Figure 1. For Pfα, only the eastern aperture was used, as the western aperture introduced more noise than signal and thus made the line profile less clear. The gray dotted portion of the Pf γ line profile is a nearby H2 line that has been masked out.
Other Images in This Article
Show More
Copyright and Terms & Conditions
© 2026. The Author(s). Published by the American Astronomical Society.
Copyright ©
2026 Astronomy Image Explorer. All Rights Reserved.