Image Details
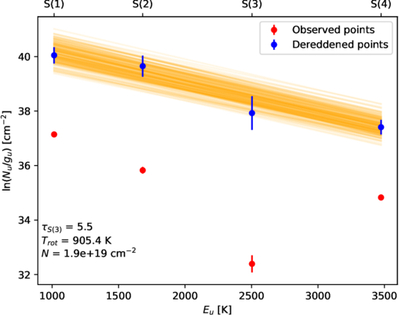
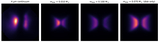
Caption: Figure 10.
Rotation diagram before and after dereddening based on the extinction fit. The orange lines show 200 samples from the MCMC fitting. We show the resulting posteriors from this fit in a corner plot in Appendix B.
Other Images in This Article
Show More
Copyright and Terms & Conditions
© 2026. The Author(s). Published by the American Astronomical Society.
Copyright ©
2026 Astronomy Image Explorer. All Rights Reserved.