Image Details
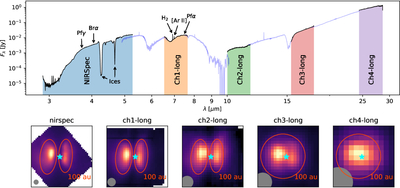
Caption: Figure 1.
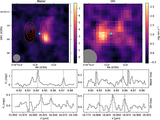
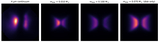
Our extracted 1D spectrum of L1527 using NIRSpec and MIRI data. The various observing channels are highlighted with different colors. Below the spectrum, we show the median-collapsed spectral cubes to demonstrate the morphology of the continuum emission for each channel. We also plot the apertures we used to extract the 1D spectra from each channel as orange ellipses. The ALMA continuum position of the source is shown with the cyan star, and the diffraction limited beam is shown as a gray circle (in future figures as well). We fill out our spectral coverage by showing data from the JOYS program (in blue) presented in R. Devaraj et al. (2026).
Other Images in This Article
Show More
Copyright and Terms & Conditions
© 2026. The Author(s). Published by the American Astronomical Society.