Image Details
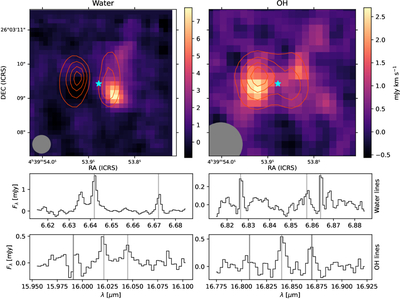
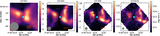
Caption: Figure 6.
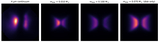
Stacked moment 0 maps for water (left) and OH (right). The contours represent the 16.0 μm continuum (for OH), and the 6.6 μm continuum (for water). The top row of spectra show the detected water lines, and the bottom row of spectra show the detected OH lines.
Other Images in This Article
Show More
Copyright and Terms & Conditions
© 2026. The Author(s). Published by the American Astronomical Society.
Copyright ©
2026 Astronomy Image Explorer. All Rights Reserved.