Image Details
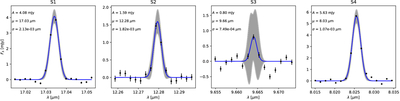
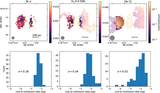
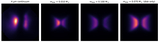
Caption: Figure 13.
The line profiles and Gaussian fits of the H2 S(1)-S(4) line used to construct the rotation diagram. The black points and error bars show the data and empirically estimated uncertainties, the blue line shows the best-fit Gaussian model, and the gray region shows the 1σ range on the model.
Other Images in This Article
Show More
Copyright and Terms & Conditions
© 2026. The Author(s). Published by the American Astronomical Society.
Copyright ©
2026 Astronomy Image Explorer. All Rights Reserved.