Image Details
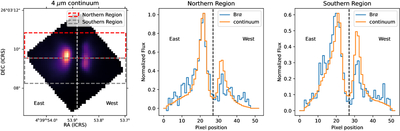
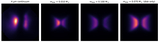
Caption: Figure 11.
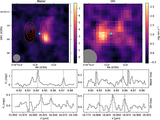
Horizontal profiles for the Brα (blue) and local continuum (red) moment 0 maps. Separate profiles are shown for the northern and southern regions of the emission maps. These profiles were created by summing the two regions shown by the dashed rectangles in the left plot along the vertical axis.
Other Images in This Article
Show More
Copyright and Terms & Conditions
© 2026. The Author(s). Published by the American Astronomical Society.
Copyright ©
2026 Astronomy Image Explorer. All Rights Reserved.