Image Details
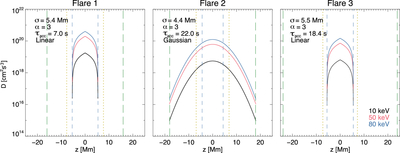
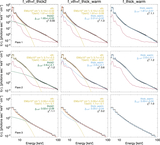
Caption: Figure 11.
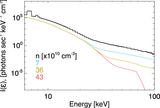
Distribution of the acceleration diffusion coefficient D(v, z) in space, from the loop apex to chromospheric boundary, using properties of the acceleration region that produce outputs that best match observations (bold in Table 4) for three different energies, i.e., 10 keV in black, 50 keV in pink, and 80 keV in blue.
Other Images in This Article
Show More
Copyright and Terms & Conditions
© 2026. The Author(s). Published by the American Astronomical Society.
Copyright ©
2026 Astronomy Image Explorer. All Rights Reserved.