Image Details
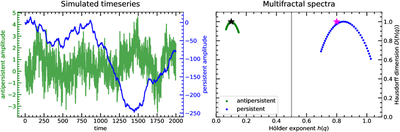
Caption: Figure 13.
The MFDFA technique applied to two simulated time series. The time and amplitude values are in arbitrary units. The green data is antipersistent, akin to Poisson noise present in X-ray detectors, and is defined as fractional Brownian motion (fBm) with a Hurst exponent H = 0.1 (B. B. Mandelbrot & J. W. V. Ness 1968). The blue data is a persistent time series, which is more akin to thermal X-ray emission, defined as fBm with H = 0.8. The stars on the right-hand plot indicate the ground truth time series Hurst exponents. An intuitive way to interpret the right-hand plot is as a probability density of different fractal behavior across the time series. The left-hand time series are snapshots of infinite processes; in the infinite-time limit, the multifractal spectra on the right would converge to the stars. The gray line indicates the persistence/antipersistence boundary h = 0.5.
Other Images in This Article
Show More
Copyright and Terms & Conditions
© 2026. The Author(s). Published by the American Astronomical Society.