Image Details
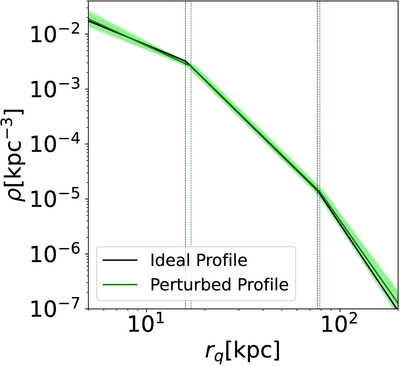
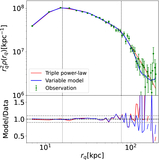
Caption: Figure 15.
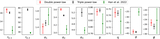
The black solid line refers to the selection-effect-free density profile based on a mock realization (ideal profile) of stars. The green line is the selection-effect-free best-fit model for the ideal profile perturbed with observational error. The green shaded region shows the statistical uncertainties of the best-fit model. The vertical dashed lines stand for the break radii of the original profile (black) and the recovered profile (green) after perturbation. Both profiles are renormalized to unity.
Other Images in This Article
Show More
Copyright and Terms & Conditions
© 2026. The Author(s). Published by the American Astronomical Society.
Copyright ©
2026 Astronomy Image Explorer. All Rights Reserved.