Image Details
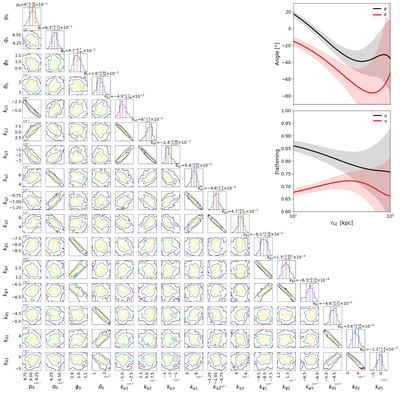
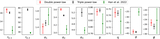
Caption: Figure 6.
The posterior contours of 16 model parameters of the variable model. Red dashed lines and blue dashed lines indicate 50th, 16th, and 84th percentiles. The meanings of different model parameters can be found in Section 3.2. The yellow, light-blue, and dark-blue contours represent the 30%, 1σ, and 2σ regions of the MCMC post-burn distributions, respectively. The two panels in the upper right corner present the dependence of the rotation angles ϕ, θ and flattenings p, q on rGC. The thick lines are the predictions from the best-fit model, and the shaded regions present the 1σ uncertainty of the variable model.
Other Images in This Article
Show More
Copyright and Terms & Conditions
© 2026. The Author(s). Published by the American Astronomical Society.