Image Details
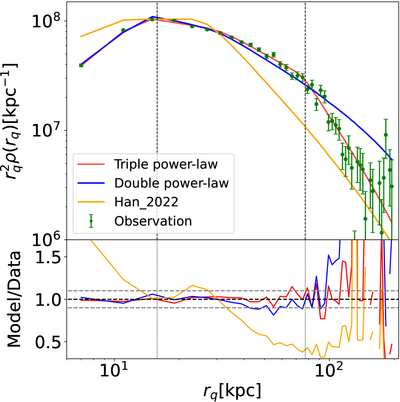
Caption: Figure 5.
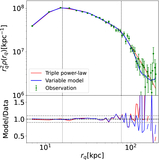
The top panel shows with green circles the observed stellar density multiplied by ﹩{r}_{q}^{2}﹩ as a function of flattened radius, rq, compared to the best-fit triple power-law model (red solid line) and double power-law model (blue solid line). Error bars represent the 1σ uncertainties computed from 100 bootstrap subsamples of our K giants. Here the best-fit triple power-law model in this work (red solid line), that in J. J. Han et al. (2022; orange solid line), and the double power-law model (blue solid line) have been convolved with the angular and radial selection functions to have a fair direct comparison with the data (see Section 3.1). Two vertical black dotted lines in both the top and bottom panels represent the two break radii, rb,1 and rb,2, respectively. Two horizontal dashed gray lines in the bottom panels represent 10% regions of the model-predicted density over observed density, with the black dashed horizontal line marking y = 1. Both triple power-law and double power-law models fit the stellar halo within 70 kpc well, but the double power-law model shows a worse match of the outer stellar halo beyond ∼70 kpc.
Other Images in This Article
Show More
Copyright and Terms & Conditions
© 2026. The Author(s). Published by the American Astronomical Society.