Image Details
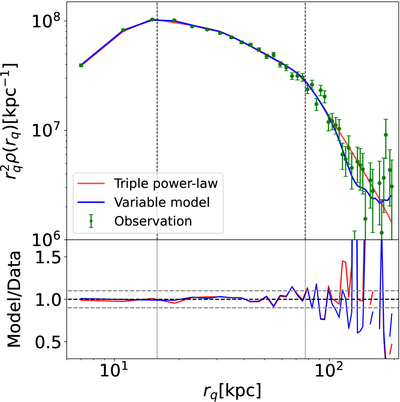
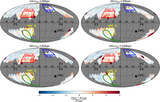
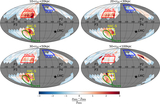
Caption: Figure 8.
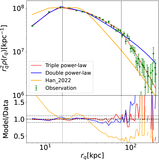
Similar to Figure 5, but the blue solid curve shows the variable model, by allowing the orientation angles and axis ratios to vary with radius. The red solid curve and green circles with error bars are the same as those in Figure 5, which are the best-fit triple power-law model profile and the real data. The model predictions have been convolved with the angular and radial selection functions (see Section 3.1) and have been renormalized to give the same total number of stars as real data.
Other Images in This Article
Show More
Copyright and Terms & Conditions
© 2026. The Author(s). Published by the American Astronomical Society.
Copyright ©
2026 Astronomy Image Explorer. All Rights Reserved.