Image Details
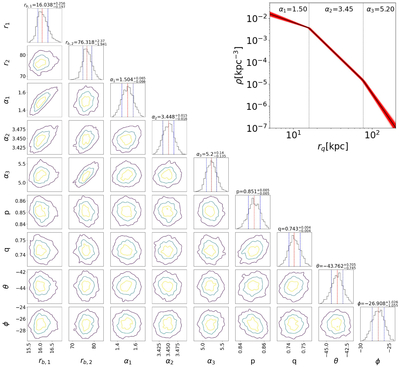
Caption: Figure 3.
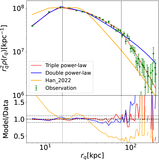
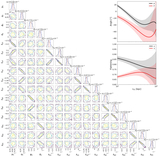
Posterior contours for different combinations of nine parameters of the triple power-law model. Red and blue dashed lines indicate 50th, 16th, and 84th percentiles. The meanings of different model parameters can be found in Section 3.2. The yellow, light-blue, and dark-blue contours represent the 30%, 1σ, and 2σ regions of the MCMC post-burn distributions, respectively. The black line in the inset panel shows the selection-effect-free best-fit model radial density profile (renormalized to unity), with the red shaded region representing the 1σ model uncertainty, and two vertical black dashed lines mark two break radii.
Other Images in This Article
Show More
Copyright and Terms & Conditions
© 2026. The Author(s). Published by the American Astronomical Society.