Image Details
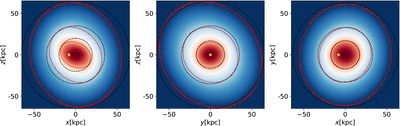
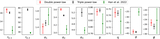
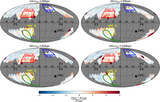
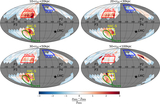
Caption: Figure 7.
The density distribution of the best-fit variable model in the x–z (y = 0), y–z (x = 0), and x–y (z = 0) slices. Here x, y, z are standard Galactocentric Cartesian coordinates. The red solid lines are isodensity contours, with the density for each outer contour decreased by a factor of 10 compared with the previous inner one. The black dashed lines indicate reference circles. The yellow pentagram denotes the location of the Sun.
Other Images in This Article
Show More
Copyright and Terms & Conditions
© 2026. The Author(s). Published by the American Astronomical Society.
Copyright ©
2026 Astronomy Image Explorer. All Rights Reserved.