Image Details
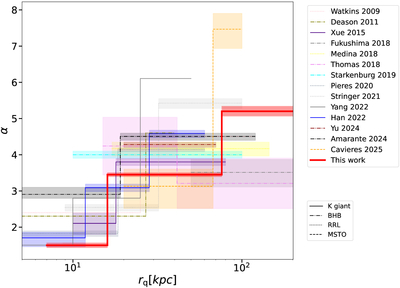
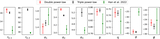
Caption: Figure 14.
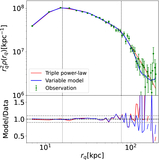
Radial density profiles of the MW stellar halo, comparing the result between this work (red solid line) and the literature. The vertical lines represent the break radii, and the horizontal lines denote the power indices within a given distance range, with the shaded range showing the uncertainties of power indices. The different line styles stand for various tracers.
Other Images in This Article
Show More
Copyright and Terms & Conditions
© 2026. The Author(s). Published by the American Astronomical Society.
Copyright ©
2026 Astronomy Image Explorer. All Rights Reserved.