Image Details
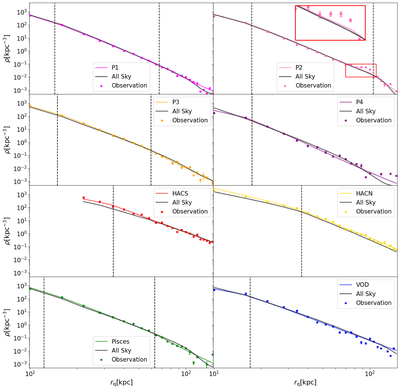
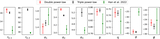
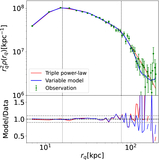
Caption: Figure 11.
In each panel, we compare the predicted density profiles of the variable model from Section 4.2 in the corresponding sky position (black curve) with the result of the triple power-law model (different color curves; see the legend), which directly fits this region. The dashed lines stand for the break radii of the density profile in this region. Note that although the black curves are based on the global fitting with the full data, they differ across different panels, as each panel corresponds to a particular pointing. Selection effects have been corrected in this figure. All colored model density profiles have been renormalized to give the same number of stars as real data at the given sky position after correcting selection effects. The black curve is renormalized to the whole sample.
Other Images in This Article
Show More
Copyright and Terms & Conditions
© 2026. The Author(s). Published by the American Astronomical Society.