Image Details
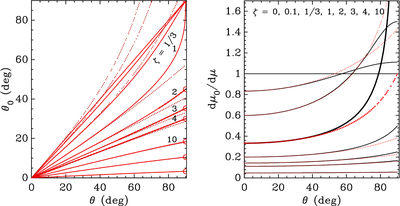
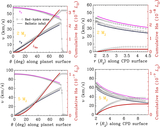
Caption: Figure 11.
Left panel: approximate starting angle (dotted red) compared to the exact solution (solid red) for different ζ values. The circles on the right show Equation (A5). Right panel: the quantity dμ0/dμ for ζ = 0, 0.1, 1/3, 2, 3, 4, 10 (top to bottom at the left y-axis). The approximation (red dotted curve; Equation (13b)) matches well, even toward large θ. Only the ζ = 1 curve (bold) diverges toward the midplane, as it should (see the left panel).
Other Images in This Article
Show More
Copyright and Terms & Conditions
© 2026. The Author(s). Published by the American Astronomical Society.
Copyright ©
2026 Astronomy Image Explorer. All Rights Reserved.