Image Details
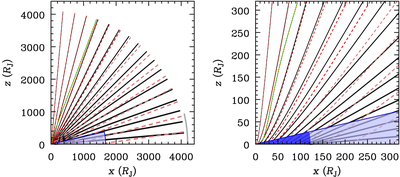
Caption: Figure 1.
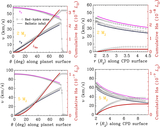
Flow pattern in the poloidal plane (“side view”) for the fiducial parameters in MKBM23. We set fcent = 0.03 (see Figure 13 for fcent = 1/3). For illustrative purposes, the CPD (blue region) ends at r = ξRHill with ξ = 0.4 (R. G. Martin et al. 2023), with the region inside Rcent = fcentRHill highlighted (dark blue). We plot implicitly the exact solution of the orbit equation (solid lines) and the small-θ0 solution (dashed red lines; pale for θ0 > 30°). The green–yellow line is the θ0 = 20° streamline from MKBM23, which is close to the θ0 = 15° streamline at our r0 = RHill. Streamlines starting closer to the midplane are shown thicker to remind the reader of the density stratification (Equation (10)). The gray arc near RHill displays the height of the CPD (90° − θCPD), and we will assume that there is in fact no inflow over those θ0 (Sections 2.2 and 2.3).
Other Images in This Article
Show More
Copyright and Terms & Conditions
© 2026. The Author(s). Published by the American Astronomical Society.