Image Details
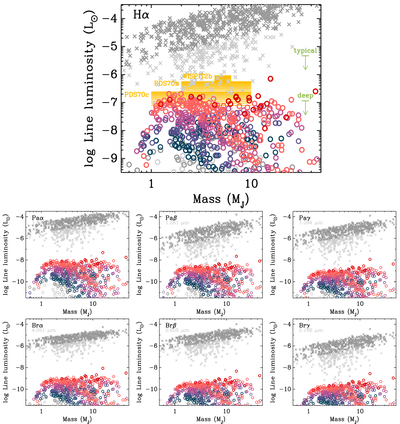
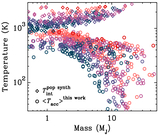
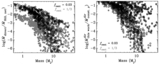
Caption: Figure 6.
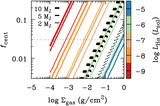
Excess line luminosity of accreting planets (open dots; see label in panels), summing the planet- and CPD-surface shocks. We plot population synthesis planets during their main formation phase (1–5 Myr together). Points are colored by accretion rate as in Figure 4(b). The gray crosses (dark for ﹩{\dot{M}}_{\,\rm{pop synth}\,}\geqslant 1{0}^{-6}\,{M}_{{\rm{J}}}\,{{\rm{yr}}}^{-1}﹩, pale otherwise) are the estimate using extrapolated CTTS relationships (J. M. Alcalá et al. 2017; O. Komarova & W. J. Fischer 2020; C. Rogers et al. 2024), using the classical ﹩{L}_{{\rm{acc}}}=G{\dot{M}}_{{\rm{Hill}},\,{\rm{net}}}{M}_{{\rm{p}}}/{R}_{{\rm{p}}}﹩. Top panel: the nondereddened luminosity and estimated masses of PDS 70 b and c (see the text) are plotted for guidance (horizontal bars; height: variability of LHα). Also, WISPIT 2 b is shown (L. M. Close et al. 2025b). Some synthetic planets are as faint as LHα ∼ 10−12 L⊙ (not shown). Segments on the right show typical or deep 99.99995% confidence-level upper limits, beyond 200 mas, from surveys or individual searches (respectively, G. Cugno et al. 2019, 2023; K. B. Follette et al. 2023), corresponding to 5σ for Gaussian residuals. Limits for individual stars can easily differ by 1 dex.
Other Images in This Article
Show More
Copyright and Terms & Conditions
© 2026. The Author(s). Published by the American Astronomical Society.