Image Details
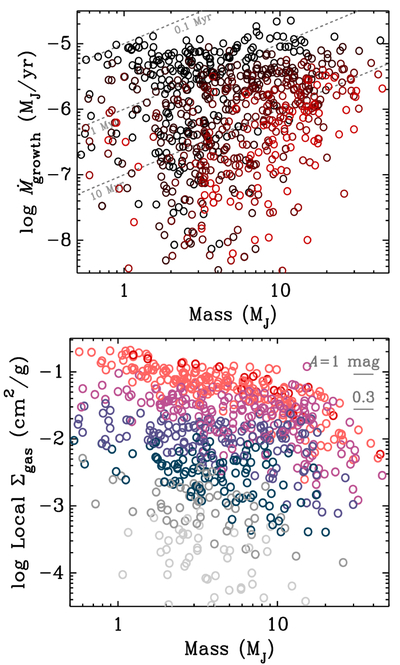
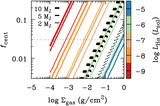
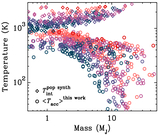
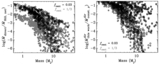
Caption: Figure 4.
Top panel: planet growth rates in NGPPS for our selected planets at 1–5 Myr (black to red). Dashed lines show characteristic growth times of 0.1, 1, 10 Myr. Bottom panel: gas surface density at the location of each planet, chosen based on the q and h parameters of the NGPPS so that our ﹩{\dot{M}}_{{\rm{Hill}},\,{\rm{net}}}﹩ equal the planet growth rate in the population synthesis ﹩{\dot{M}}_{\,\rm{pop synth}\,}﹩ (Equation (22)). Colors indicate ﹩\mathrm{log}{\dot{M}}_{\,\rm{pop synth}\,}/({M}_{{\rm{J}}}\,{{\rm{yr}}}^{-1})﹩ in bins with edges at {∞, −5, −5.5, …, −7.5, −∞} (dark red, salmon, lilac, purple, dusty blue, gray, pale gray). Short line segments on the right indicate the Σ for which the vertical extinction A = 1 or 0.3 mag when ﹩\kappa =10\,{\mathrm{cm}}^{2}\,{{\rm{g}}}_{\mathrm{gas}}^{-1}﹩ (see the text).
Other Images in This Article
Show More
Copyright and Terms & Conditions
© 2026. The Author(s). Published by the American Astronomical Society.