Image Details
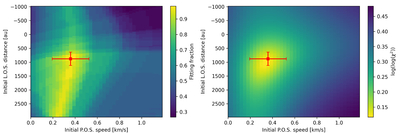
Caption: Figure 8.
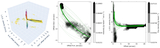
Distribution of goodness-of-fit estimates as functions of free parameters: initial speed on the POS (x-axis) and initial spatial offset in the LOS direction, for TIPSY fitting for structure C. Here, the initial direction of the gas in the POS (third free parameter) is fixed to the value for the best fit. Left panel: distribution of the fraction of coordinate values of points in the observed streamer curve (intensity-weighted means and standard deviations), which is consistent with the theoretical trajectories. Right panel: distribution of ﹩{\mathrm{log}}({\mathrm{log}}({\chi }^{2}))﹩ deviations between the observed streamer curve and theoretical trajectories. In both plots, yellow regions represent good fits.
Other Images in This Article
Copyright and Terms & Conditions
© 2026. The Author(s). Published by the American Astronomical Society.