Image Details
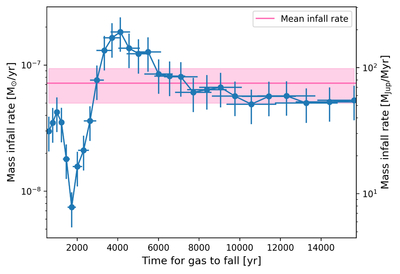
Caption: Figure 7.
Expected variation of the mass infall rate (y-axis) as a function of time (x-axis) due to observed substructures within the streamer, as discussed in Section 3.2. The pink line and associated shaded region represent the mean infall rate for the streamer and the uncertainty on it.
Other Images in This Article
Copyright and Terms & Conditions
© 2026. The Author(s). Published by the American Astronomical Society.
Copyright ©
2026 Astronomy Image Explorer. All Rights Reserved.