Image Details
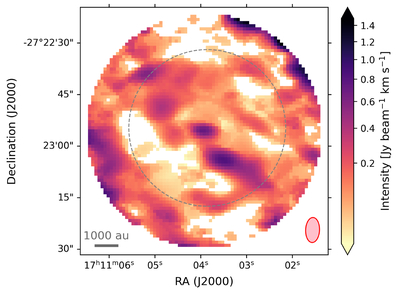
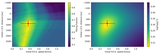
Caption: Figure 2.
ACA (7 m array) integrated intensity (moment 0) maps of the C18O (2–1) emission line. The horizontal gray line in the bottom-left corner represents a length scale of 1000 au, and the pink ellipse in the bottom-right corner represents the beam size. The gray dashed circle denotes the half power beamwidth of the primary beam.
Other Images in This Article
Copyright and Terms & Conditions
© 2026. The Author(s). Published by the American Astronomical Society.
Copyright ©
2026 Astronomy Image Explorer. All Rights Reserved.