Image Details
Caption: Figure 3.
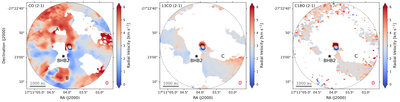
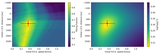
Intensity-weighted velocity (moment 1) maps of all three CO isotopologue emission lines imaged for this analysis: CO (2–1) (left), 13CO (2–1) (center), and C18O (2–1) (left). The horizontal gray lines in the bottom-left corners represent a length scale of 1000 au, and the pink ellipses in the bottom-right corners represent the beam size. Black contours denote the continuum emission (5σ) from the protoplanetary disks. The locations of structures A, B, and C and the nearby source BHB2 are marked on the maps.
Other Images in This Article
Copyright and Terms & Conditions
© 2026. The Author(s). Published by the American Astronomical Society.
Copyright ©
2026 Astronomy Image Explorer. All Rights Reserved.