Image Details
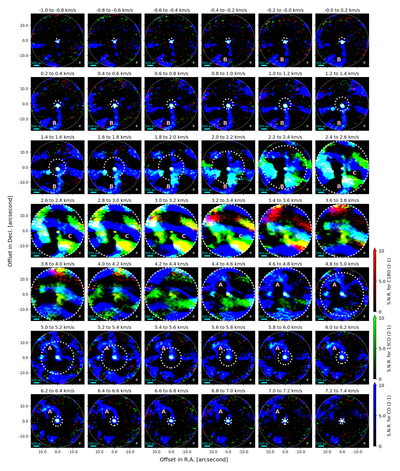
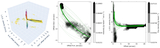
Caption: Figure 4.
CO (2–1) (blue), 13CO (2–1) (green), and C18O (2–1) (red) channel maps. The color bars indicate the S/N of the observed emission. Dotted white circles in the channel maps denote the maximum bound radius (rPOS,bound), as defined in Section 3. Overlap of emission from different lines is seen as cyan (CO and 13CO), yellow (13CO and C18O), and white (all three lines) colors. The horizontal lines in the bottom-left corners, the ellipses in the bottom-right corners, and the gray solid circles represent a length scale of 500 au, the beam size, and the field of view of the data, respectively. The locations of structures A, B, and C are marked on the maps.
Other Images in This Article
Copyright and Terms & Conditions
© 2026. The Author(s). Published by the American Astronomical Society.