Image Details
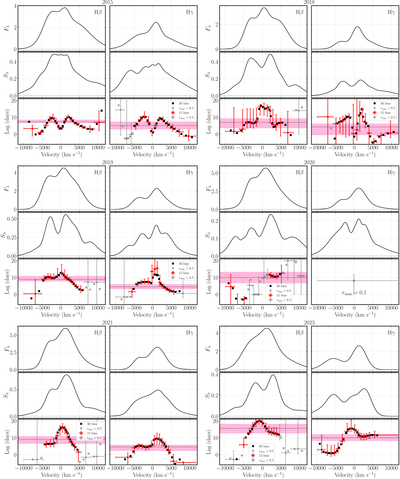
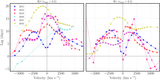
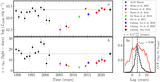
Caption: Figure 4.
Velocity-resolved RM results for the 2023 season (bottom right). For comparison, updated results from previous seasons (2015, 2018, 2019, 2020, and 2021) are shown. The top panels of each group of 6 panels shows the mean spectrum; the middle panel shows the rms spectra of broad Hγ (right) and Hβ (left). The bottom panel displays centroid time lags versus line-of-sight velocity, based on 15 (circles) and 30 (squares) equal-flux velocity bins. Horizontal error bars represent half the bin width. Gray symbols indicate bins with maximum correlation coefficients below 0.5. No RM detection was obtained in 2020 for Hγ due to weak variability. The horizontal dotted line and pink band mark the average lag and its uncertainty for each season.
Other Images in This Article
Copyright and Terms & Conditions
© 2025. The Author(s). Published by the American Astronomical Society.