Image Details
Caption: Figure 6.
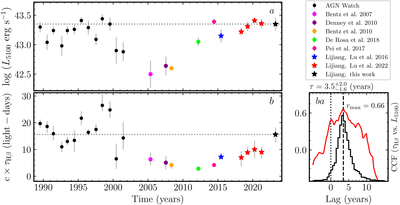
Variations of the optical luminosity (a) and the BLR radius (b) for NGC 5548 measured between 1988 and 2023, and the result of cross-correlation analysis (panel (ba)). The different symbols with different colors are used in the left panels to distinguish the different campaigns, The horizontal dotted lines in panels (a) and (b) mark the optical luminosity and BLR radius positions for the 2023 observing season, Both parameters in 2023 have already reached levels comparable to their historical maxima. In panel (ba), the red solid curve is the CCF between the BLR radius and the optical luminosity (﹩{r}_{{\rm{\max }}}=0.66﹩), and the black histogram is the cross-correlation centroid distribution (CCCD), the vertical dashed line marks the measured time lag of ﹩3.{5}_{-1.6}^{+2.0}﹩ yr, the vertical dotted lines are reference lines of zero time lag.
Other Images in This Article
Copyright and Terms & Conditions
© 2025. The Author(s). Published by the American Astronomical Society.