Image Details

Caption: Figure 2.
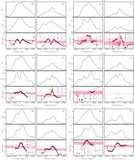
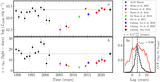
Light curves and the results of cross-correlation analysis. The left panels ((a)–(e)) are the light curves of the AGN continuum at 5100 Å and the broad He II, He I, Hγ, and Hβ emission lines; the contamination of this data by the host galaxy has been eliminated by spectral decomposition. The red arrows indicate a transient dip in the AGN continuum and the corresponding time-delayed dip in the emission line flux. The horizontal dotted lines represent the mean flux. The right panels ((aa)–(ea)) are corresponding to the ACF of the continuum and the CCF between the broad-line light curves (b)–(e) and the continuum variation (a); the histogram in black is the cross-correlation centroid distribution (CCCD). We note the variability amplitude of Fvar in panels (a)–(e) and the maximum cross-correlation coefficient of ﹩{r}_{{\rm{\max }}}﹩ in CCF panels (ba)–(ea). The measured time lags in the rest frame are marked by the vertical dashed lines in panels (ba)–(ea); the vertical dotted lines are reference lines of zero time lag. The units of F5100 and emission lines are ﹩{\rm{erg}}\,{{\rm{s}}}^{-1}\,{{\rm{cm}}{}^{-2}\,\mathring{\rm A} }^{-1}﹩ and erg s−1 cm−2, respectively.
Other Images in This Article
Copyright and Terms & Conditions
© 2025. The Author(s). Published by the American Astronomical Society.