Image Details
Caption: Figure 1.
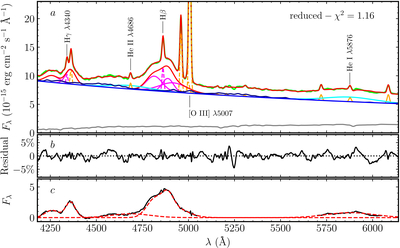
Spectral fitting and decomposition of the mean spectrum calculated from the calibrated spectra. Panel (a) illustrates the details of spectral fitting and decomposition, where the mean spectrum is shown in lime; the total model in red; and the fitting components include the AGN continuum (blue), iron multiplets (navy), host galaxy (gray), broad Balmer lines (solid magenta), narrow Balmer lines (dashed magenta), broad helium lines (cyan), narrow helium lines (orange), [O III] narrow lines (dashed orange), and other weak narrow emission lines (solid orange). Vertical reference lines are added at the rest wavelengths to mark the broad Hγ, He II, Hβ, He II, and [O III] λ5007 lines. Panel (b) displays the fitting residuals in percentage. Panel (c) presents the net broad Hγ, He II, Hβ, and He I lines, where the fitted broad-line profiles (models) are indicated by red dashed lines, and the broad-line profiles after subtracting other fitted components from the spectrum are shown in black.
Other Images in This Article
Copyright and Terms & Conditions
© 2025. The Author(s). Published by the American Astronomical Society.